
News Articles
Construction Industry
5 Metrics you should be tracking in your construction business
15 January 2023


The construction industry in Australia faces unique business and operational challenges and can be highly unpredictable. Over time, margins in the sector have tightened, and margin and contract management are more critical than ever.
This is accompanied by the additional challenge in the industry of attracting and retaining quality employees.
These challenges make monitoring and reviewing your business benchmarks essential for business success.
While we recognise that no two businesses in this sector are the same, we believe there are five key benchmarks all construction businesses should be actively tracking and reporting.
1. Gross Profit Margins

By Job
It seems the most obvious metric to be tracking, yet so many businesses move on to the next job and fail to take the time to review the profit and performance of each project, comparing the actual result with the budget or estimate. In the current market of tightening margins, this has never been more important. Without this insight, recurring trends on issues will go unnoticed.
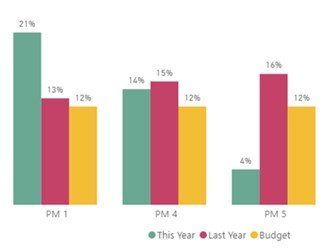
By Project Manager
Are you allocating the right work to the right employee? Have you reviewed your project managers' performance (and other staff, including estimators, site managers, etc.) across the business, as well as across the various segments of your business? Perhaps one of your project managers is performing well for some work types but poorly in others. Possibly one project manager is far outperforming the others, and the intel as to how this is being achieved can be shared throughout the business. Until you track these metrics, you cannot make the informed decisions to ensure your business operates in the most effective and efficient way.
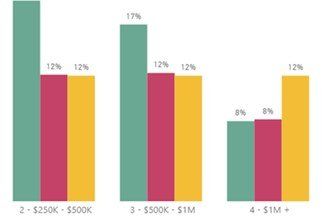
By Contract Value
How much of your profit is generated by high-value projects when compared to smaller jobs? You may find that high-value jobs are generating a large proportion of your revenue but a much smaller proportion of your profits due to squeezed margins. By tracking this metric target contracts can be identified.
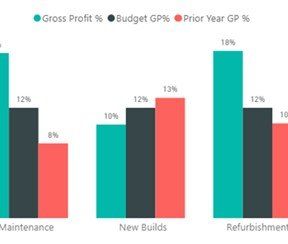
By Service Offering
Every business offers multiple service offerings, whether it be New Builds v Renovations or Residential V Commercial, it is important to track how profitable each of your service offerings are and to view this with an eye to target new opportunities within your industry and drive efficiencies.
By Client & Client Group
Which of your clients and client industries are generating the most revenue and the highest gross profit? How does this compare with the clients which cause the most headaches or require the most administration? Are there some clients or client groups on which you should be focusing your efforts and others which could be managed more efficiently?
2. Your Real Cost of Labour
In our discussions with clients we have found that a number do not fully understand the cost of their employees.
Questions which are common include:
- How much per hour does an employee cost an employer?
- How much should be charged for labour by a service organisation?
The answers to these are different for each employer. We have created an easy-to-use calculation to assist our clients in considering their own situation.
This calculation takes into account all the costs relating to each employee, including downtime and unproductive time, to give you the real cost of the labour unit per day/hour.
3. Pipeline
As a business owner, you need to be focused on both the revenue coming in today as well as looking forward to the revenue that is projected into the future.
Inherent in this process is the review of your pipeline of work. Your pipeline should be carefully monitored and reported on by:
- Month – do you have a pipeline of work which will carry your business, assets and employees through the coming months. Has the work been planned and allocated accordingly?
- Employees – has your pipeline of work been evenly and appropriately allocated to your key staff?
- Type of work – have you reviewed your pipeline of work by service offering and compared this with the margins historically earned for each of these? If your pipeline of work is in areas where you have historically low margins, should you be reviewing processes with an eye to increasing efficiencies or generating leads and applying for tenders in segments with higher margins?

Pipeline example
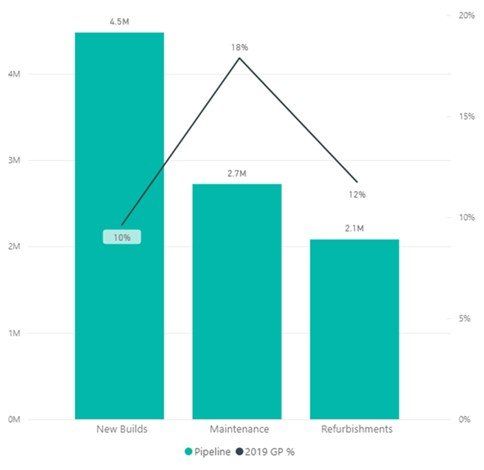
Type of work example
4. Asset Utilisation
Construction businesses are generally very asset rich and purchasing a new asset or retiring an old asset is a common, but important, business decision. However very few businesses track how much their assets are being used on an asset-by-asset basis. This simple metric can help business owners to make targeted decisions about purchasing, hiring or selling assets within their business.

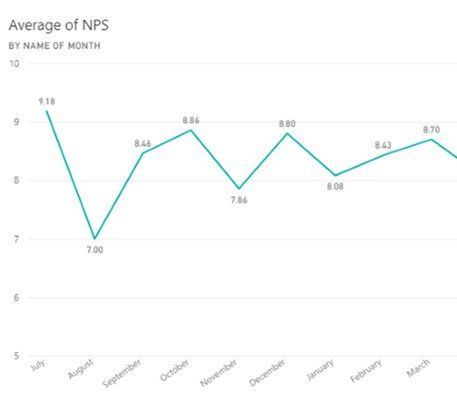
5. Net Promoter Score
The final metric we consider essential is the Net Promoter Score (NPS). This score tracks the results of one simple question asked to your customers:

The results of this simple question can tell you about how satisfied your customers are and how likely you are to generate new work off the back of the work performed for that client. If the results are low and you have identified either passive clients or detractors of your business, work must be done to identify the shortfalls in your business performance and rectify these going forward.

How can Brentnalls SA help?
If you would like to discuss the 5 metrics or other business matters with an experienced Chartered Accountant who specializes in your industry, speak to the team at Brentnalls SA.
Discuss Further?
If you would like to discuss, please get in touch.
Disclaimer
The information provided in this article does not constitute advice. The information is of a general nature only and does not take into account your individual financial situation. It should not be used, relied upon, or treated as a substitute for specific professional advice. We recommend that you contact Brentnalls SA before making any decision to discuss your particular requirements or circumstances.